January
2015,
May
2017.
CLIMATE
COMMENT
NOTE. Figures are mostly from Wikipedia, and the figure might no longer exist in Wikipedia. However most figures were from peer reviewed sources.
Commenters
(aka
"commentators")
in
the
popular press tend to get facts about climate wrong. e.g. Paige Taylor
in The Australian P5, 5th September 2016 made the natural assumption
that the last Ice Age
ended just before Aboriginals built stone houses about 9,000 years ago.
ABSTRACT
- The
earth
has
had
five
ice
ages. We are currently at the end of a "warm period" (aka
"interglacial period") of the fifth (Quaternary) ice
age which started ~2.6 million years ago. (See blue colour periods in
Fig 1).
- The previous four Ice
ages lasted for between 30,000,000 years (e.g. the Andean-Saharan)
and 300,000,000 years (Huronian).
- The
"current"
(fifth)
ice
age
has
lasted for about 2,600,000 years. It is currently as warm as it
is because an interglacial
period started 10,000 years ago.
- Approximately
each
100,000
years
of the last million years of the current ice age there has been a
"summer period" (aka an
"interglacial period") lasting about 10,000 years. These
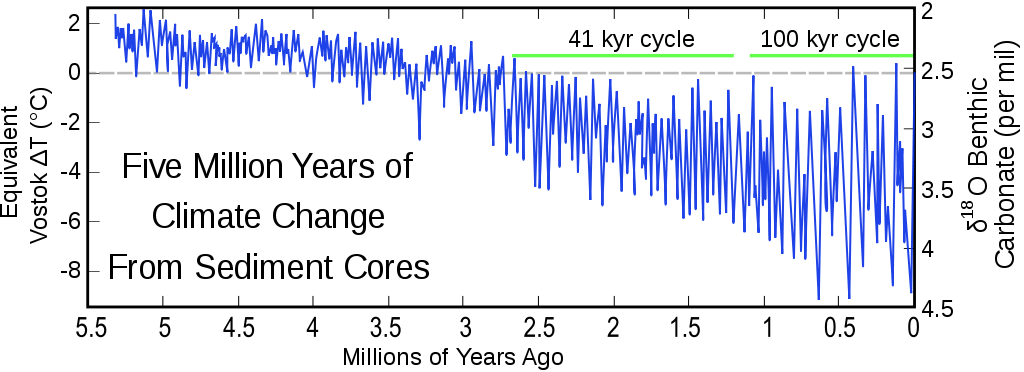
interglacial periods were much closer together (41,000 years period) in
the
earlier stages of the current (aka quaternary) ice age. (See Fig
2).
- There have so far been about 30-45 "summer periods" so far during the quaternary ice age.
- What
Paige
Taylor
was
probably
referring
to when she implied that something happened 9,000 years ago "just after
the last ice age ended" was a reference to the start of the current
interglacial period during the current Ice age.
Her implication that the quaternary ice age had ended is unsupported by
any historic evidence or rationale. (See Fig 3).
- During
these
interglacial
("summer
periods")
the
global temperature rises by around 9C (=16F) to reach a temperature
normally between 3C and 6C higher than it is now (Fig.4. See dotted
lines on Epica and Vostok data.).
- During
these
interglacial
periods
the
sea
level typically rises by about 110 meters (360 feet).
- So if historical precedent of over 30 occasions continues, we can shortly, (within at most about 500 years) expect the world to get much colder.
- The
fall
in
temperature
will
be
quite rapid. (See figures 3, 4 & 5 below.) The fall is likely to be
10C = 18F.
- We can expect glaciers to advance from the poles towards the equator, and the sea level to fall by over 100 meters.
- Quite
possibly
we
could
drive
from
Australia to Asia, and the Mediterranean sea would become a string of
lakes. The Great Barrier Reef will be an inland calcium outcrop.
I will not detail the negative effects that such (9C) cooling
would
have on the human race. Suffice to say, it makes the warmist's
concerns about a 3C rise look like a Sunday School picnic.
I hope for my grandchildren's sake that our efforts at causing
global warming will serve to reduce that cooling. Because I have
the gut feeling that if something has happened for over 2 million
years with clockwork regularity, and if nobody has a credible
explanation as to why it has been happening, then it is more likely
than not that it is going to continue happening.
THE
AGREED FACTS
1. GLOBAL ICE AGE TIMELINE.
From
geological,
fossil
and
carbon
dating
evidence,
scientists
believe
that
the
Earth
has
experienced at least four “Ice
Ages” in it's 4.5 billion year existence. We are currently in the
fifth ice age. Figure 1 is a graph from
Wikipedia showing ice ages in colour. I have created Table 1
below to provide details of ice age dates.

| Huronian |
Cryogenian |
Andean-Saharan |
Karoo |
Current |
| 2,400 - 2,100 MYBC |
850-635 MYBC |
460-430 MYBC |
360-260 MYBC |
2.6 MYBC to now. |
Table
1 Dates of the known ice ages.
The Cryogenian was reputedly the coldest ice age. There is
discussion among scientists as to whether glaciers reached the equator
= "Snowball Earth" or perhaps that some oceans at the equator were
still water = "Slushball Earth". In between ice ages it is
believed that there were periods when tropical conditions existed at
the poles.
At
the moment the average depth of ice on Antarctica is about 2,160
meters, spread over an area of 14 million square kilometers. The
area of the world's oceans is 360 million square kilometers. So
if all of the ice on Antarctica melted, the sea level would rise
something less than 2,160 * 14 / 360 which is 84 meters. NASA reports 83 billion
tons of ice as melting each year (2014) from W Antarctica (the bit that
is losing mass). Ice weighs slightly less than 1 tonne per cubic
meter. So if we spread 80 billion (80 x 10^9) cubic meters of
melted ice over 360 million square kilometers = 360 x 10^12 sq meters
of ocean, the sea level would rise by: {Vol=Area x Height, so H=V/A} So
H = (83 * 10^9) / (360*10^12) meters which is 2.3 * 10-4 meters which
is less than 1/4 of a millimeter per annum, or about an inch per
century.
Put
another way, if the annual loss of ice from the Antarctic ice sheet was
rained onto Queensland it would produce 5 mm (20 points) of rain which
would not break the drought.
2. CURRENT ICE AGE
TIMELINE
The current Ice Age started approximately
2,600,000 years ago. Anthropologists agree, more or less, that is
about when Homo Sapiens (aka Humans) first appeared on planet
Earth. Figure 2 from Wikipedia shows
temperatures over the last five million years plotted as hotter or
colder than the annual world's mean today, which is the dotted "zero"
line near the top.
THINGS TO NOTICE:
- About 2.6 million years ago, the fifth (current) world glaciation began.
- Before the current ice age started, the world temperature was more than 1C (2F) warmer than it is today.
- Initially, the temperature during glaciation periods only dropped by two or three degrees Centigrade.
- As
the ice age progressed the world's temperature during glaciation
periods dropped by as much as 10C. (18F)
- In
between each glaciation periods there would be a short (10,000 year)
hiatus, called an "interglacial period", during which temperatures
would warm to the current world temperature.
ICE CORES
In
the last few decades scientists have drilled deep (3,190 meters) into
ice lakes in Antarctica. By analysis of the material of these
"ice cores" they were able to determine relative temperatures and sea
levels over the last 800,000 years.
This sequence followed an earlier cycle of glacials/interglacials having a period of 46,000 years. (Shown in mid RHS of Fig. 2).
Typically during interglacial periods (i.e. right now, 2015AD) the average global temperature rises by 7C – 9C. (13F – 16F).
The Ice Core results are shown in Figures 3, 4 and 5.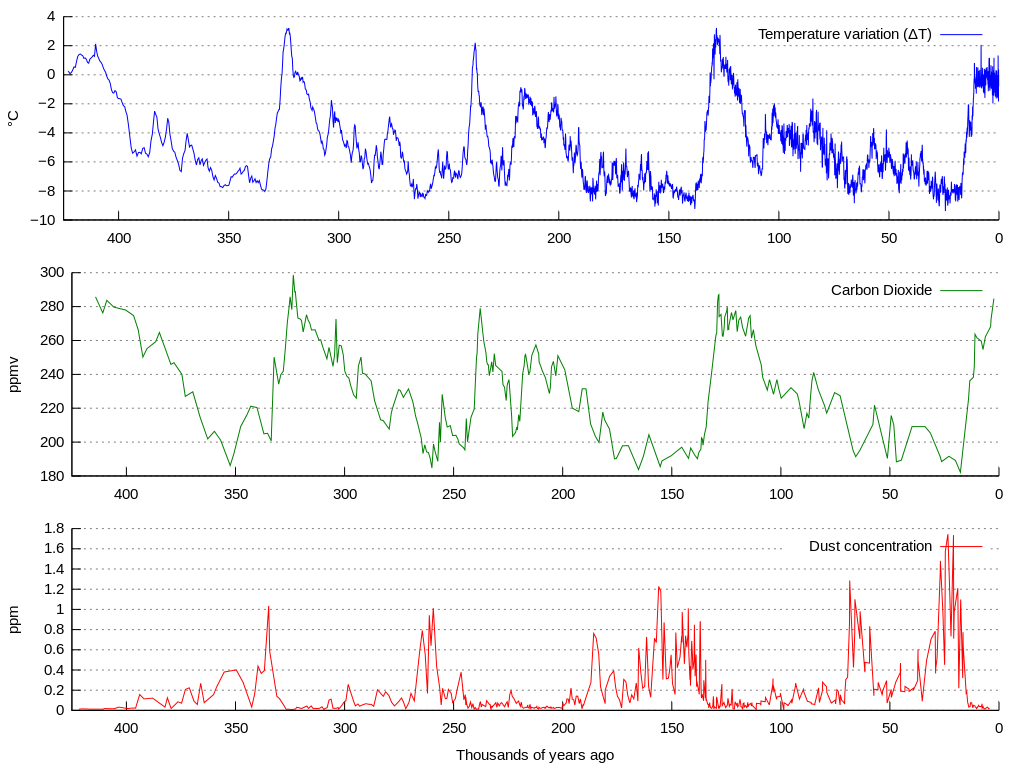
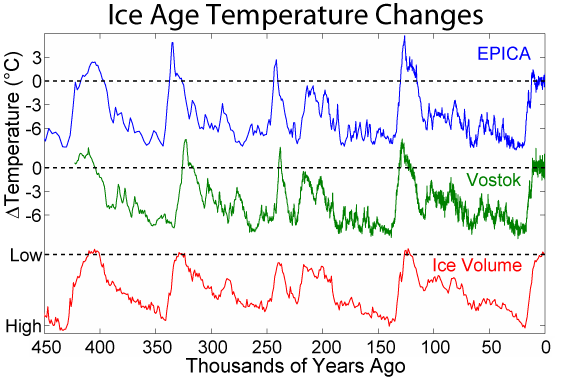
Showing how the EPICA cores confirmed the Vostok cores over 400,000 years. Note that “ice volume” (bottom of Fig 4) vertical ordinates are inverted. The amount of ice captured during the glacial periods is not trivial. The sea level was 110 meters (360 feet) below it's present value. The approximately 100,000 year period of interglacials over the last million years is shown in both the Epica and the Vostok cores.
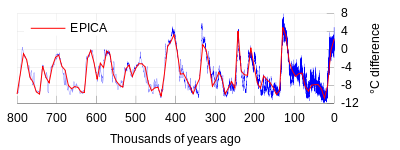
Figure
5
A
more extended view (800,000 years) of the EPICA results.
THINGS TO NOTICE
- Note the regularity of warm (aka "Interglacial") periods
each 100,000 years. .
- The warm periods are quite short. About 90% of the time over the last million years, the world was 6C-12C (11F-22F) colder than it is today.
- Note that during the last four warm periods the temperature was as much as 6C (11F) warmer than today.
- Note also the
not so warm but extended warm period 500,000 years ago. (aka
"Termination V").
- Note that there is a
progression of cold periods getting colder. The most recent was
11C colder than today.
- It is thought that Carbon Dioxide (CO2) is a dependency. There is evidence that temperature rose from glacial, and then CO2 followed (from 0.018% to 0.028%)
3. CURRENT INTERGLACIAL TIMELINE
We
are currently in the Holocene (interglacial) period of the Quaternary
Ice Age. The Holocene
started about 10,000 – 12,000 years ago. (Figure 6). It is typical that
the sea level rises during an interglacial period by around 110 meters
or 360 feet. So over the last 2 million years the sea level was
normally 110 meters lower than it is today.
Beside being colder, the weather during a glacial period is less turbulent and rainfall is greatly reduced. Reduced rainfall on the few "temperate" zones that would presumably exist (having migrated into the tropics) would likely make Agriculture difficult.
It is not considered to be a coincidence that the earliest recorded instances of agriculture in Egypt, India, China & Mesopotamia are dated at around 10,000 – 12,000 years ago. When the last cold period ended.The next graph from Wikipedia shows a further contraction in the time scale from half a million years to 10,000 years.
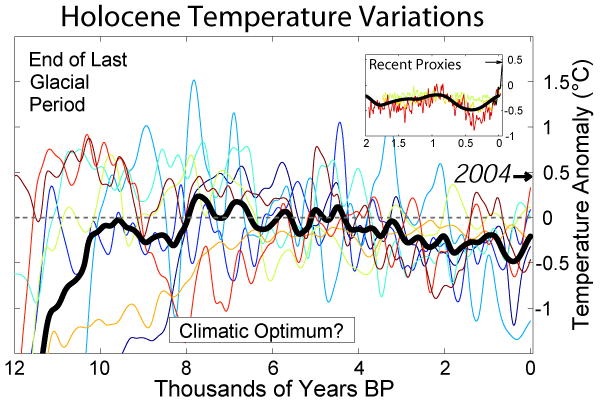
The black line is
the average of 10 different studies. It can be seen (Fig 5) that
the temperature rose steeply by about 12C (22F) to our present day
temperature over the previous 5,000 years. It can be seen that
the cooling trend (0.5C/8,000y) of the last 8,000 years has recently
halted. That warming is ascribed by some authorities to the fact
that the CO2 concentration has risen from 0.028% to 0.04% in the last
century.
4. TIMELINE SINCE ZERO BC
The last two thousand years of temperature change is shown below in Fig. 7
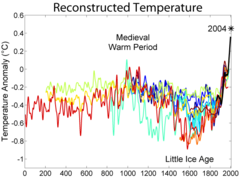
From Wikipedia. Shows reconstructed proxy temperature studies from ten sources covering the last 2,000 years. The data seem to illustrate that the industrial revolution (1760) coincided with the end of the "Little Ice Age" (or perhaps staved off the end of the Holocene interglacial period.)
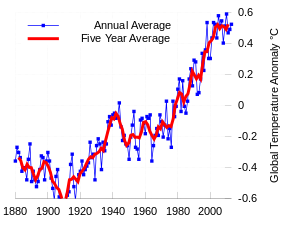
In the last few decades the planetary
temperature has risen by about 0.5C. The evidence for planetary
temperatures over the last 130 years as displayed by Fig. 8 is disputed. There are
recent challenges to the data "adjustment" procedures used by climate
scientists who prepared the graph.
WHAT ARE THE FACTS?
- The CO2 concentration in the atmosphere has gone from around 0.028% in the middle of the 16th Century to around 0.04% in 2014.
- CO2 is a "Greenhouse Gas" and acts like a blanket to contain heat within the atmosphere.
- The
scientific
community
is
well
aware
that
the
current
interglacial
period
was
due
to end. See for instance the
2004 “EPICA” paper in Nature,
Volume 429, Issue 6992, pp. 623-628
(here) by about 60
authors. They tentatively compare the onset of the current interglacial
with that of a (cherry picked?) interglacial period that occurred half
a million years ago, (i.e. five glacial periods in the past, aka
"Termination V ') concluding: Given
the
similarities
between
this
earlier
warm
period and today, our
results may imply
that without human intervention, a climate similar to the present one
would extend well into the future.
(Underlined
emphasis
is
mine).
I
ask
my
reader
to
try
to
spot
the
alleged similarities in Figure 5. Of
all the "warm" periods, the one at 500 thousand years ago looks cooler
and longer lasting (25,000 years) than the four warm periods that
followed it, which were generally 6 degrees warmer and lasted about
10,000 years each.
- See also the 2007 paper by Dr Tyrrell of The University of Southampton. entitled “Next Ice Age Delayed By Rising Carbon Dioxide Levels”.
- There is no general consensus on the cause or extinction of ice ages, either the large scale ice age periods or the smaller ebb and flow of glacial-interglacial periods within an ice age. (From causes of ice ages, wikipedia, 30/1/2015). The consensus that does exist is that it may be a mix of the following: (a) Atmospheric (CO2 & CH4) composition, (b) orbital changes, (c) Milankovitch cycles, (d) tectonic plates, (e) variations in solar output, (f) meteorites, (g) vulcanism. And probably a few other causes that nobody has thought of yet. This means the party is not pooped. Nobody has to shout out loud (and risk losing their government research funding – see cartoon below) that burning carbon may have stopped the catastrophic ending of the current interglacial period by increasing the greenhouse gases in the atmosphere.
COMMENT:
The
warmist website "skepticalscience.com"
has
published
the
Vostok
data,
(Top
of Fig 3 above) and dismissed the
idea that the current 10,000 years old interglacial is ending.
They reason that
"The cycle appears to be
a response to changes in the Earth’s orbit and tilt" and
continue:
- These two factors, orbit and tilt, are weak and are not acting within the same timescale – they are out of phase by about 10,000 years. This means that their combined effect would probably be too weak to trigger an ice age. You have to go back 430,000 years to find an interglacial with similar conditions, and this interglacial lasted about 30,000 years.
- The warming effect from CO2 and other greenhouse gases is greater than the cooling effect expected from natural factors. Without human interference, the Earth’s orbit and tilt, a slight decline in solar output since the 1950s and volcanic activity would have led to global cooling. Yet global temperatures are definitely on the rise.
Countering those points from skeptical:
- The explanation "orbit and tilt" are "out of phase" defies
logic. If two cycles are out of phase by 10,000 years, and need
to coincide to produce or end an ice age, they
do not coincide after 430,000 years. It is also notable (Fig 3
& Fig 4) that the preceding interglacial periods were around 3C -
6C warmer than our current interglacial.
- The mere assertion that the warming effect of CO2 and other gases is greater than cooling from natural (read "unknown") historic sources relies on the assumed/calculated value of the constant in the Arrenhius equation*, which determines the Temperature Sensitivity to CO2 concentration. Other academics (Roy Spencer, University Alabama, Nicola Scafetta, U Naples) think the IPCC assumed value it is out by a factor of 2 or more. Since the assumed value was based on selected values of Global temperature and CO2 before the current warming hiatus, perhaps it is time that the IPCC revised it's calculation of the temperature sensitivity constant.
Footnote. * Arrhenius equation as modified for IPCC2001
is: dT = SConst * Ln(C/Co) where dT is Temperature change, and C/Co is
the ratio of CO2 concentration, and SConst is the sensitivity.
AN EXAMPLE CALCULATION of SENSITIVITY CONSTANT
Below I show in three cases how sensitivity could be calculated.
I obtained the
Temperatures from Fig. 8 above, and obtained CO2 concentrations
from cdiac.ornl.gov
Case 1. Temperature rise 1910 to 1940 -0.6C to -0.1C =
0.5C.
CO2 from 299.3 to 310.4 ppm. SConst = 0.5/Ln(310.4/299.3) =
13.7
Case 2. Temperature rise 1940 to 1980 -0.1C to -0.05C = 0.05C.
CO2 from 310.4 to 338
ppm SConst
= 0.05/Ln(338/310.4) = 0.02
Case 3. Temperature rise 1880 to 2016 -0.3C to +0.5C =
0.8C. CO2 from 289.8 to 400 ppm
SConst = 0.8/Ln(400/289.8) = 2.48
As can be seen, the choice of time period can have a huge effect on
the calculation of sensitivity. And looking at all the data,
there does not seem to be a very strong correlation (as Arrhenius
suggests) between CO2 concentration and temperature.
In Figure 9 below I have used the IPCC formula (Arrhenius) to
calculate the
temperature rise (dT) for future CO2
levels of 500 ppm and 600 ppm starting from the present level of
400ppm using the IPCC formula with different "sensitivity" constants:
dT
=
Sensitivity
*
Ln(CO2/400)
| dT =
Sens.Const * Ln(CO2/400) |
CO2 = 500ppm |
CO2 = 600 ppm |
| Sensitivity
Const. = 13.7 |
dT = 3.1C |
dT = 5.6C |
| Sensitivity
Const. = 2.48 |
dT = 0.56C |
dT = 1.0C |
Figure 9
Of course, other elements will serve to exacerbate or diminish
warming. This model assumes solar insolation remains
constant. It is predicted to fall due to predicted reduced
sunspot activity. In that case, the world might actually get
colder.
(Note to self: Buy on wool futures)
ARGUMENT
Scientists
do not agree on
what causes the warming that causes interglacial periods,
or
the
cooling
that
ends interglacial
periods. Consider:
- If
a CO2 increase caused the historic (interglacial)
warming, then what caused the CO2 concentration to rise so rapidly from
0.018% to 0.028%, like clockwork, every 100,000 years? Is there a
volcano that belches out CO2 every 100,000 years?.
- OTOH
is
there
"something
else"
that
causes
the temperature rise, which then causes
the CO2 rise. Which
raises the question, when might that "something else" cause the planet
to catastrophically drop into it's next ice age?
I
have
argued
above
that
orbit
and tilt (as proposed by Skepticalscience) do
not explain the increase in
the length of the glacial periods from 41,000 years to 100,000 years.
(See Fig 2)
- If CO2 causes warming, then why did the interglacial
just 120,000 years end? The CO2 level stayed high (above 270ppm)
for 10,000 years while the planet cooled by 5C. This also
happened when an interglacial period ended 400,000 years ago.(See Fig 3
above).
So at
the very least, Skepticalscience.com's certainty that the ice will not
come back soon is
open to dispute.
There is no evidence that the outcome of global warming is bad. Very few warmists consider less than a 2C rise to be alarming. Most warmists consider more than 5C rise would be catastrophic. They appear to ignore the fact that during the last interglacial period 100,000 years ago the temperature was 3-5 C above it's present value.
The
main thrust of their alarm seems to be (a) Sea level rising, (b)
inclement weather and (c) problems resulting from ocean acidification.
WHERE NEXT?
Our world is not well organised. The UNFAO estimates that 870 million people suffer from undernourishment, and UNWFP estimates that around 3 million children under 5 starve to death each year. At the same time, rich greenies in their massive SUVs drive up the world price of grain by turning it into ethyl alcohol and using it as a substitute for gasoline.
Alternative energy supplies are subsidised by taxes on carbon energy. That makes electricity more expensive. Power being more expensive, the poorest and most vulnerable members of our society freeze in winter and roast in summer.
And those alternative energy supplies have their own problems. Wind farms produce infrasonic sound, which has tentatively been established as producing health problems. (See peer reviewed report by Steven Cooper). Solar cells require rare earths, which produce extremely poisonous pollution in their production.
These evils are so unnecessary. As a Libertarian I believe that if Governments would keep out of the way, and stick to the job of taxing poisonous pollutants, technology would solve those problems. In solar cell technology the price is falling and efficiency is rising at such a rate that already solar electricity can be produced for an amortised cost of 10 - 12 cents per KWH. All we need is an energy storage system. A recent article by Giles Parkinson reports that power storage costs should drop to $230/KWH by 2018. The author cites Citigroup, HSBC and UBS as having estimated that at that price, fossil fuels will go into “terminal decline”.
But no. It seems that no government in the world can resist a tax that can be promoted to the voters as a "moral imperative". And a carbon tax appears to fit that bill. Without one, we are told, our children will inherit a barren world.
“But surely,” you say, “this proof of climate change is based on sound, peer reviewed scientific research by reputable scientists?” Again I cite the EPICA abstract from Nature:
"Given the similarities between this earlier warm period and today, our results may imply that without human intervention, a climate similar to the present one would extend well into the future."
Personally I do
not consider that such a tentative conclusion by a body promoted as
consisting of possibly the most authoritative group of climate
scientists in the world can be used by governments to justify the
levying of taxes equivalent to 2%** of Gross World Product.
According to
the world factbook, world GDP (PPP basis) was $75 trillion in
2013. So they recommend a tax of nearly $2 trillion per year,
(growing with inflation..)
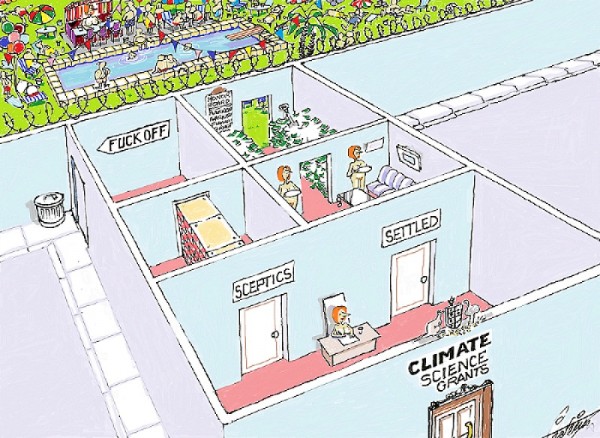
Pickering?
** a forever tax equivalent to 2% of world GDP would be required to
stabilize CO2 at 0.05% according to Nicolas Stern, author of the Stern
Review.
email
barvennon@hotmail.com
